
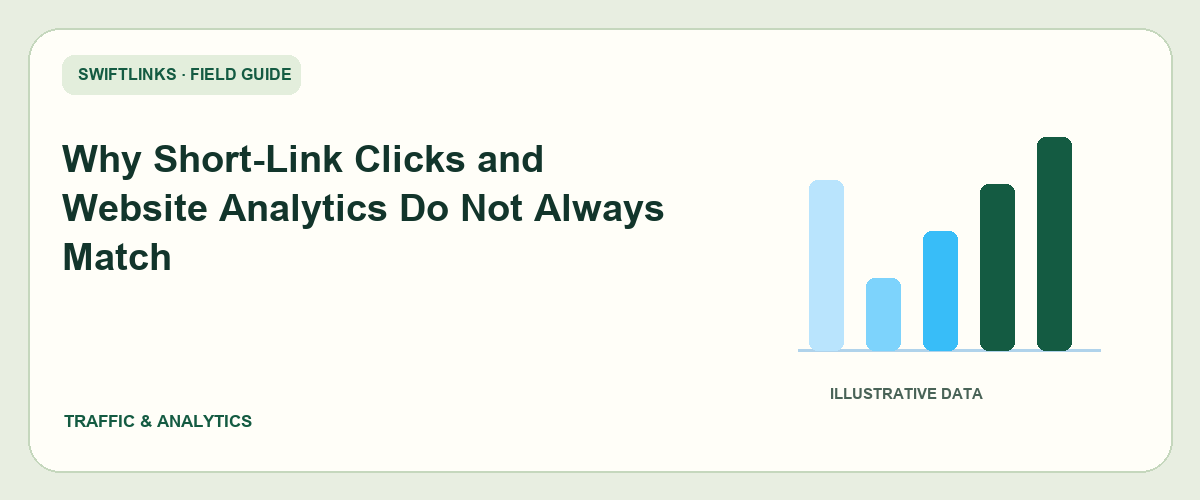
You open a short-link report and see one number. Your website analytics shows another. That difference is a reason to inspect the measurement setup, not immediate evidence that either tool is broken.
The first task is to name the measures precisely. “Traffic” is too broad when one report counts link requests and another groups website activity into sessions or events.
Write down what each number means
Read the labels and definitions in the tools you use. Separate total clicks, unique clicks, sessions, page views, and completed actions in your notes.
Do not compare a shortener's total with a website tool's unique visitors and expect them to be identical. The labels represent different questions, even before technical differences enter the picture.
If a tool does not document how it estimates unique activity, avoid giving that estimate more certainty than its definition supports.
Align the destination and date range
Verify that the short link points to the website property you are checking. A redirected campaign can move to a new page while someone continues reviewing reports for the original property.
Then compare a fixed period in the same timezone. Write the start and end times explicitly. Midnight boundaries are an easy source of apparent disagreement after an evening campaign.
Exclude unrelated links and pages from the comparison. A site-wide session total cannot explain the performance of one campaign route on its own.
Test where the journey is measured
Open the short link and confirm the final destination. Check whether the destination's tracking is installed and whether its testing tools recognize your visit under the conditions you use.
A redirect request can happen before the landing page finishes loading. If a visitor leaves during loading, the two tools may observe different parts of the journey.
Consent choices, browser behavior, filtering, and repeated visits can also affect the available measurements. Treat these as setup-dependent factors rather than assigning one universal percentage to the expected difference.
Separate automatic checks and internal tests
A campaign's links may be opened by systems as well as readers. Your team may also test the same route several times before publishing it.
Record those checks. For a campaign with little activity, a few internal requests can noticeably affect the total. For a large campaign, they may be negligible, but the explanation should still be clear.
Do not change filtering settings in the middle of a comparison without noting the change. Otherwise, the report may appear to show audience behavior when it actually shows a change in measurement.
Build a report with both measures
Use columns such as “recorded link requests,” “website sessions associated with the campaign,” and “completed registrations.” Put the definitions beneath the table.
An illustrative result of 120 link requests and 85 recorded sessions is not a diagnosis. It is a starting point for checking repeat visits, loading, consent, and filtering in the actual setup.
When should you investigate further?
Investigate when a previously stable relationship changes suddenly, when a test visit is missing from the expected tool, or when the destination no longer matches the campaign. Small differences by themselves are less informative than a clear change in behavior.
Keep the distinction between interest, arrival, and completion visible. That is the basis of a report people can understand without treating every number as interchangeable.
Map the measurement points in the journey
A short-link service records activity at the redirect route. Website analytics usually records activity after the destination loads and its measurement mechanism runs. The two systems are looking at different points in the journey, so equal counts should not be the default expectation.
Write the route as a sequence: shared hyperlink, any email tracking wrapper, short route, final page, analytics collection, and useful action. Identify the tool counting each stage. A request can reach one stage without reaching the next.
For example, a browser might request a short route and then lose connectivity before the destination loads. A security system might inspect the route without behaving like a normal browser. A person might reach the page but decline analytics consent. Those situations affect the relationship between counters in different ways.
The map helps you investigate a discrepancy without treating every mismatch as a bug. It also prevents a reporting shortcut in which a route request is renamed a visitor, session, or conversion even though the service did not measure that event.
Compare definitions before numbers
Make a small metric dictionary. For each tool, record what its value represents, whether repeated activity is included, whether filtering is applied, and what time boundary it uses. If a definition is unavailable, mark it as unknown rather than assuming it matches another system.
Google's Analytics session documentation explains how sessions are counted in Analytics. A session is not simply a request to a short URL. A person may click a route several times during one session, or return in a later session.
Likewise, an estimated unique click may use different grouping from an analytics user metric. Neither should be treated as a verified count of individual people without understanding the method. Shared devices, browser changes, and privacy controls complicate identity-based comparisons.
Use the metric names accurately in reports. “Recorded short-link requests” and “measured destination sessions” may sound less dramatic than “visitors,” but they make the evidence easier to assess.
Align dates and timezones
A one-day comparison can be misleading when tools use different timezones. Activity near midnight may belong to different dates in the two systems. Specify a reporting timezone and compare equivalent start and end instants where the tools allow it.
If you only have calendar-day views, choose a period broad enough to reduce boundary confusion and disclose the limitation. Do not claim precise hourly agreement from reports that expose only daily totals.
Check whether one tool shows lifetime activity while another is filtered to the campaign week. A lifetime short-route total includes earlier testing, previous uses, and late visits. The destination report may show only a narrow campaign label or current page path.
Also account for reporting delay. A freshly refreshed dashboard and a processed analytics report may not update at the same pace. Wait according to the platform's documented reporting behavior before concluding that a recent event is permanently missing.
Check consent and collection conditions
Destination analytics can depend on scripts, consent settings, browser capabilities, and network access. A successful page visit does not guarantee that every analytics request is sent or stored. Privacy tools and blockers can affect collection.
Test the page's measurement implementation with the platform's appropriate debugging tools. Check both the intended consent behavior and the behavior after consent is given where relevant. Do not bypass visitors' choices merely to make two counters agree.
A missing tag or broken event configuration can create a real collection problem. The short route may work perfectly while analytics records little activity. Fix the implementation and document the change date before comparing later data with earlier periods.
Avoid using a single administrator browser as the only test environment. Staff may have different consent, access, or extension settings from ordinary visitors. Test representative conditions and describe what was verified rather than claiming universal coverage.
Examine redirects and campaign labels
A later redirect can discard query parameters, switch hosts, or send visitors to a different page. Open the exact published route and inspect the final destination. Compare it with the complete tagged address saved in your campaign register.
If the destination has deliberate URL cleanup behavior, the visible browser bar may not retain every parameter. Use the analytics testing tools to confirm collection rather than relying on appearance alone. Conversely, seeing tags in the bar does not prove that the analytics implementation recorded them correctly.
A campaign filter can also hide activity. If the shortener counts all requests to a route while the analytics report shows only one source or campaign spelling, the populations differ. Check for alternate labels, case differences, and corrected destinations used midway through the campaign.
Keep the unfiltered destination context available when appropriate. It can help distinguish a tagging problem from a collection problem. Do not change campaign labels randomly until a preferred number appears.
An illustrative reconciliation table
Imagine a charity information page reached through a newsletter route. This hypothetical example uses qualitative observations rather than fabricated traffic results.
| Evidence | What it establishes | What it does not establish |
|---|---|---|
| Short-route activity | Requests reached the route | Every request was a different reader |
| Destination sessions | Analytics measured page activity under its rules | All successful page visits were collected |
| Completed enquiry records | The form system stored submissions | Every submission was a qualified enquiry |
| Send log | The message was distributed at a recorded time | Every recipient read or clicked it |
The team checks the same campaign interval across the tools. It identifies internal tests and confirms that the destination's collection works under intended conditions. It then reports the tools separately with an explanation of the remaining gap.
This approach does not force the counts to match. It makes their meanings explicit. A useful report can show several stages without pretending that they describe identical people or events.
Investigate repeat visits and automated requests
A person can click the same route several times. They may reopen a message, compare an offer, or use a different device. A shortener's total can rise each time according to its counting rules, while destination analytics groups some activity differently.
Automated fetching adds another possible difference. Message previews, security checks, search crawlers, and monitoring processes can request addresses. Tools may identify and filter some of that activity, but their rules differ and filtering is not perfect.
Look at available patterns and documented definitions rather than assuming that any excess is entirely automated. A difference can have several causes at once. If request-level evidence is unavailable, acknowledge that you cannot precisely allocate the gap.
Do not publish raw log identifiers to make a marketing point. Aggregate operational evidence and handle any personal data responsibly. The goal is to understand measurement, not expose visitors or recipients.
Use ratios carefully
Dividing completed actions by total short-link requests produces a number, but the result is only meaningful when the numerator and denominator fit the question. If the denominator includes repeated or automated requests while the numerator represents unique confirmed orders, calling it a precise visitor conversion rate is misleading.
Choose a compatible basis from the destination system when possible. Even then, understand event definitions and attribution rules. A purchase may be credited according to the platform's model rather than the last short route the person opened.
Report actual counts beside any ratio and state the period. Small totals can produce large percentage swings. A change from one action to two is mathematically large in relative terms but weak evidence for a broad claim.
Use the ratio as a diagnostic clue, not an automatic verdict. A lower result may reflect a changed audience, offer, device mix, or collection method. The next step is to investigate those conditions, not assume the shortener created poor traffic.
Build a repeatable discrepancy checklist
Start by checking the published hyperlink, final destination, and campaign register. Then align the reporting window and metric definitions. Confirm analytics collection under the intended consent conditions. Review repeated visits, internal tests, and possible automated fetching.
Write down each confirmed explanation and each unresolved possibility. If you change the destination or measurement implementation, record the time and compare later periods separately. Reconciliation becomes easier when a report contains these operational notes rather than only totals.
Escalate a technical issue with reproduction steps. “Analytics looks wrong” is difficult to act on. “This published route reaches the right page, but the campaign field is missing in the debugging view after the redirect” identifies a narrower problem.
A recurring discrepancy may simply reflect the tools' different purposes. Once you have checked for faults, decide which metric answers which business question. Use route activity for distribution monitoring and destination evidence for on-page tasks, without trying to make them interchangeable.
Frequently asked questions
Which tool should I trust?
Trust each tool for the event it reliably measures. The shortener can help monitor requests to a route. Destination analytics describes collected website behavior under its own rules. Operational systems establish stored orders or submissions. A disagreement does not automatically make one tool dishonest or useless.
Should I expect a fixed percentage difference?
No universal percentage applies. Audience behavior, browser settings, automation, consent, implementation, and reporting definitions vary. Track your own patterns after confirming the setup, and investigate meaningful changes. Avoid applying a guessed correction factor to every campaign.
Can I fix the mismatch by changing the short alias?
Only if the current route is part of a verified problem. A clearer alias may improve sharing, but it does not repair missing analytics collection or align session definitions. Fix the layer responsible for the discrepancy and preserve the route history.
What should a client report say?
Name the metrics accurately, state the period and timezone, describe verified limitations, and separate requests from useful completions. Explain what was checked and what remains uncertain. Clear definitions make the report more credible than a forced single visitor number.